Transportation is emerging as potential drivers of innovation and economic growth in the 21st century. Rapidly evolving technologies and business models for delivering services using Artificial Intelligence have the potential to dramatically transform the global transportation sector in the times to come.
Every year, thousands of lives are lost on the road nationwide, and every year, road safety becomes more and more important. It should be seen from both an **awareness **and **prevention **outlook and AI can lend a helping hand to solve this problem.
Now coming onto the problem of this challenge:
- Problem Overview
Given events report **captured by On Board Units installed on buses and **Grey Spot data collected by Collision avoidance system. We plan to achieve two major objectives
-
Rate Driver Behavior
-
Predict accident hotspots
The hackathon focuses on approaching this noble and important issue from a prevention outlook backed by technological development.
I would like to thank Niti Aayog, Government Of India for presenting us an opportunity to be a part of such an important issue.
- Solution Architecture
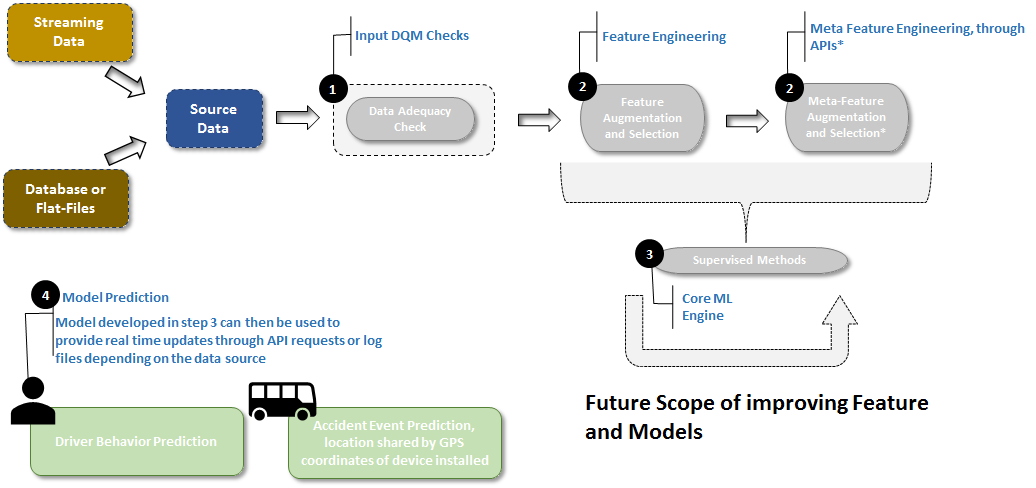
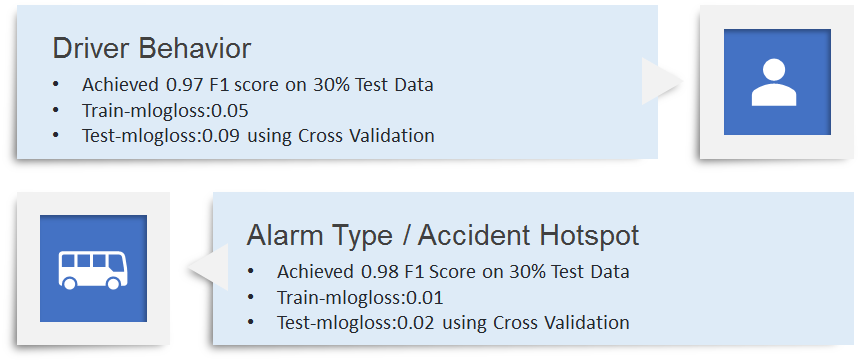
- Solution Overview & Analysis- Driver Behavior
We plan to use the given datasets and predict driver behavior using events data. We augmented the data with new features like weekday and weekend data. Hour wise data. Using Event Unit and Event Value (Upper limit =51km/h) variables we created 3 other variables time (seconds), acceleration (m/s2) , and speed(km/h).
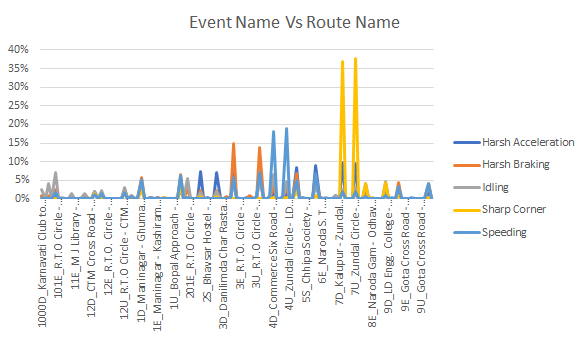
i). Route-Wise Driver Behavior Analysis — We see that 7D and 7U have Sharp Corner while Harsh Breaking is observed in 3D and 3U. Speeding Behavior is observed in maximum routes like 4D, 4U, 5S, 6E etc.
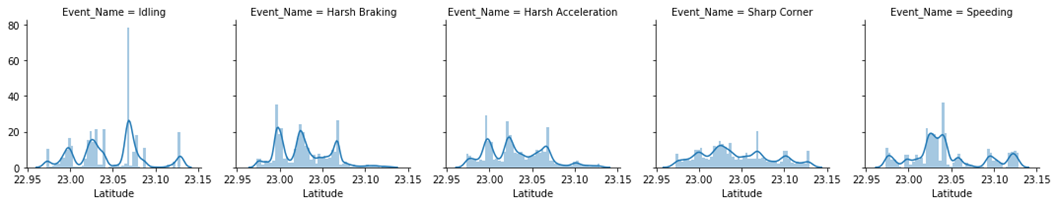
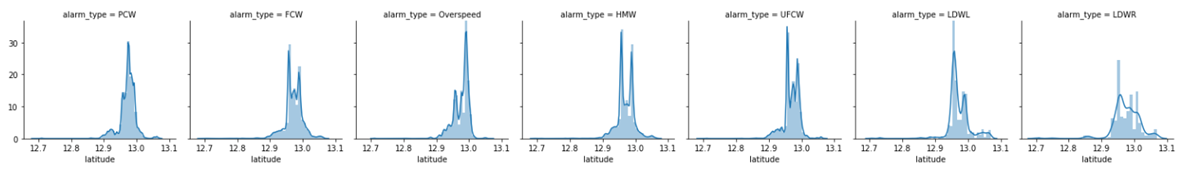
ii) Latitude/Longitude Wise Driver Analysis - Density Plots of Latitudes for different types of Driver Behavior. The variation observed in the density distribution for latitudes shows that it is an important determinant of driver behavior, the latent factor involved here is the terrain of the location capture by coordinates.
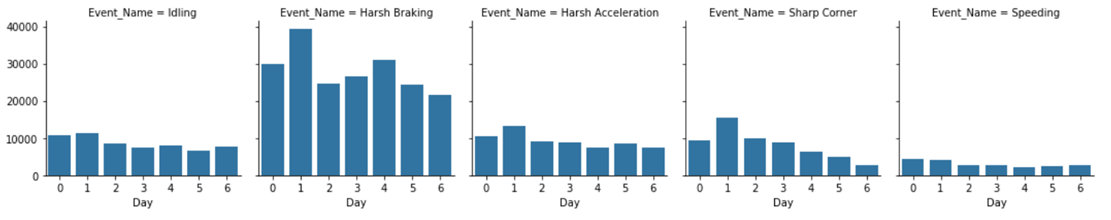
iii) Day Wise Driver Analysis - Frequency Plot of Driver Behavior observed w.r.t to a day of the week. We see harsh braking following almost a uniform distribution. But Behavior like acceleration, sharp corner and speeding have a declining trend
- Solution Overview & Analysis- Accident Hotspot
For accidental hotspot prediction, we did an alarm type and speed wise analysis and found a correlation amongst them. We also performed a time-based distance clustering to find and rank accident hotspots in a ward.
We can also include traffic data and road type data using google maps API.
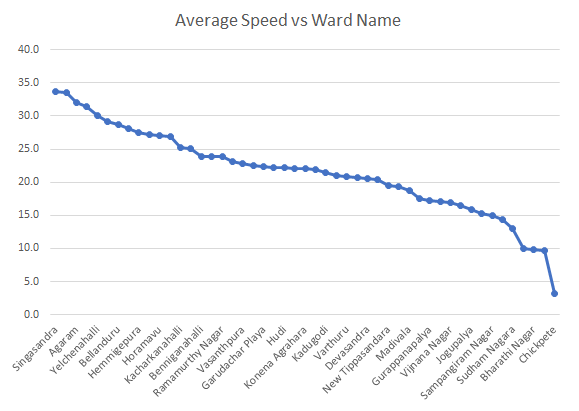
i) We see a declining trend when average speed for a ward was plotted. This shows that certain wards like Bharathi Nagar, Chickpete, Sudham Nagara etc. are subjected to lower average speed as compared to wards like Singasandra, Agaram etc.
We feature engineered this variable into our model, and it had a very high predictive power, which was expected.
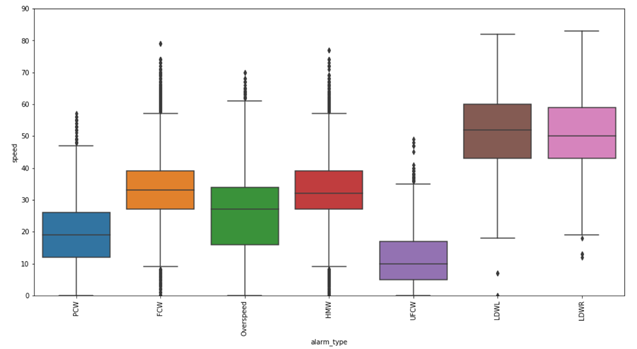
ii) Certain Alarm Types are subjected to higher or lower speed levels. Like LDWL/LDWR etc. are associated with high-Speed Levels. Whereas warnings such as PCW, UFCW etc. are subjected to low-speed levels.
iii) Density Plots of Latitudes for different types of Driver Behavior. The variation observed in the density distribution for latitudes shows that it is an important determinant of driver behavior, the latent factor involved here is the terrain of the location capture by coordinates.
- Machine Learning Model:
For this problem we used XGBoost Machine learning model. Because:
XGBoost (Extreme Gradient Boosting) is an optimized distributed gradient boosting library. Xgboost is a robust tree-based model. This model can capture all the linear and non-linear patterns present in the data. A boosting model like XGBoost keeps in check the variance and bias of a trained model and does not overfit on the data. It also does not get affected by collinearity and correlation amongst variables.
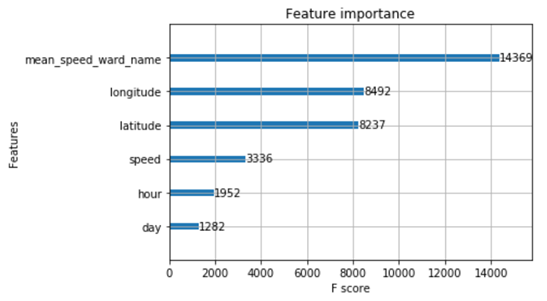
Important variables predictive of Driver Behavior:
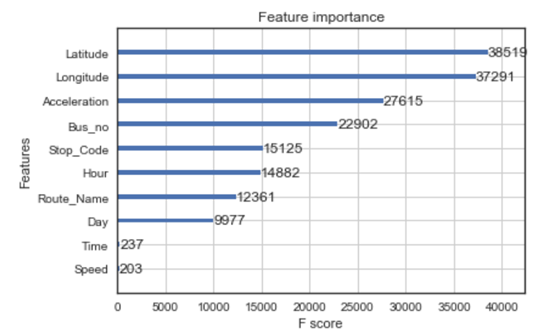
Important variables predictive of Alarm Alert/ Accident Hotspots:
- Model Results:
- Improvements & Potential Solutions
We feel that the given data is not sufficient to enable real-time alerts and driver behavior on road safety due to the following reasons :-
1)No data about road type or condition like potholes, non-tar road etc.
2)No data about elevation, traffic signals and signs on a road where the event took place.
3)Lighting conditions on road.
4)Driver specific features like fatigue state, age, and experience.
We also feel that the following mentioned advances can be useful to mitigate road safety issues:-
Having real-time interaction with the driver.
1) Through speech recognition system check for slurred or slow speech, triggered when the car is over-speeding/making sharp turns or accelerating harshly.
2) A facial recognition system to check for fatigue state of the driver such as drowsy or sleepy eyes.
3) Operational issues like non-functional traffic lights, potholes on the road etc. should be addressed on priority basis.
4) Use of satellite imagery to check road conditions periodically.
5) Awareness campaigns should be strengthened with an old adage in mind of “Prevention is better than cure”
— — — — — — — — — — — — — — — — — — — — — — — — — — — — — — —
You can access the codes from this Github repo: https://github.com/Overfitter/MoveHack_RoadSafetyChallenge
Thank you, Anshik BAnsal, for helping me with this challenge :).
Thank You for reading :)!
Cheers!!